

You've got a launch date in nine days, forty creator pitches in your inbox, and enough budget to fund only six partnerships. The follower counts look impressive, but two of the biggest accounts have comment sections dominated by emoji-only replies and follower growth that appears to have stalled after a burst of questionable activity.
Instagram engagement rate becomes a decision metric instead of a vanity metric. Raw likes, views, and follower counts can look healthy while hiding an inactive or poorly matched audience. A properly selected engagement rate helps you compare creators of different sizes, identify meaningful audience action, and decide whether a creator is likely to support the campaign objective.
The catch is that there isn't one universally correct formula. Follower-based, reach-based, impression-based, and views-based engagement rates answer different questions. By the end of this guide, you'll be able to pull the right inputs, calculate the main variants, average results across multiple posts, and spot the creator signals that deserve a closer audit. For broader campaign planning, creator marketing agency guidance can add useful operational context, but the measurement logic starts here.
Table of Contents
Why Instagram Engagement Rate Matters for Creator Vetting
Follower count tells you how large a creator's potential audience is. It doesn't tell you whether that audience is active, relevant to your category, or likely to respond to a recommendation. Engagement rate adds that missing context by converting visible interactions into a normalized measure.
A creator with a smaller audience can produce more useful audience action than a much larger account with weak participation. That doesn't make engagement rate a perfect proxy for sales, but it does make it a more useful first filter than audience size alone. The metric is especially valuable when you're comparing creators across different follower tiers.
What the metric can reveal
A healthy profile usually shows more than a single attractive percentage. Look for patterns across recent posts:
- Audience activity: Comments, saves, and shares indicate different forms of response, from conversation to utility and distribution.
- Niche relevance: A creator can have strong engagement in a category that has little connection to your product. Rate and brand fit must be reviewed together.
- Content consistency: One exceptional post shouldn't outweigh a long run of weak results.
- Distribution efficiency: Reach and views can show whether content travels beyond the existing follower base.
Likes and views are easy to overvalue because they're visible and simple to quote in a pitch deck. They're also incomplete. A post with modest likes but meaningful saves and shares may be more useful for a product education campaign than a post with passive reactions alone.
Practical rule: Treat engagement rate as a screening signal, not a signing decision. Validate audience geography, content fit, sponsored-post history, and the creator's ability to deliver the required format.
The denominator changes the interpretation. A follower-based rate asks how much of the creator's audience interacted. A reach-based rate asks how strongly people who saw the content responded. An impression-based rate accounts for repeated exposure, while a views-based rate is more natural for video-first analysis.
That's why the best vetting process doesn't stop after calculating one number. Pull the creator's recent content, apply a consistent method, then inspect where the rate comes from. If the result depends on one viral post, a narrow content format, or unusually efficient distribution, you need to know that before approving the brief.
The Standard Engagement Rate Formula by Followers
A creator shortlist often starts with public profile data, before you can access reach or impression reporting. In that situation, Engagement Rate by Followers, or ERF, gives you a consistent screening measure:
ERF = total interactions ÷ total followers × 100
Count likes, comments, saves, and shares when those metrics are available. Including saves and shares captures stronger content actions than a like-and-comment-only calculation. For the formula and its normalization logic, see Sprout Social's Instagram engagement rate breakdown. A second walkthrough is available in analytics engagement rate by MetricsWatch.
Pull the inputs carefully
Open the post or Reel's Insights panel and record every interaction your team has agreed to include. Capture the follower count as close as possible to the publication time. The current profile total may not match the audience size when the content was published.
Use this workflow:
- Add likes, comments, saves, and shares.
- Divide the total by the relevant follower count.
- Multiply by 100.
- Label the result clearly as follower-based engagement rate.
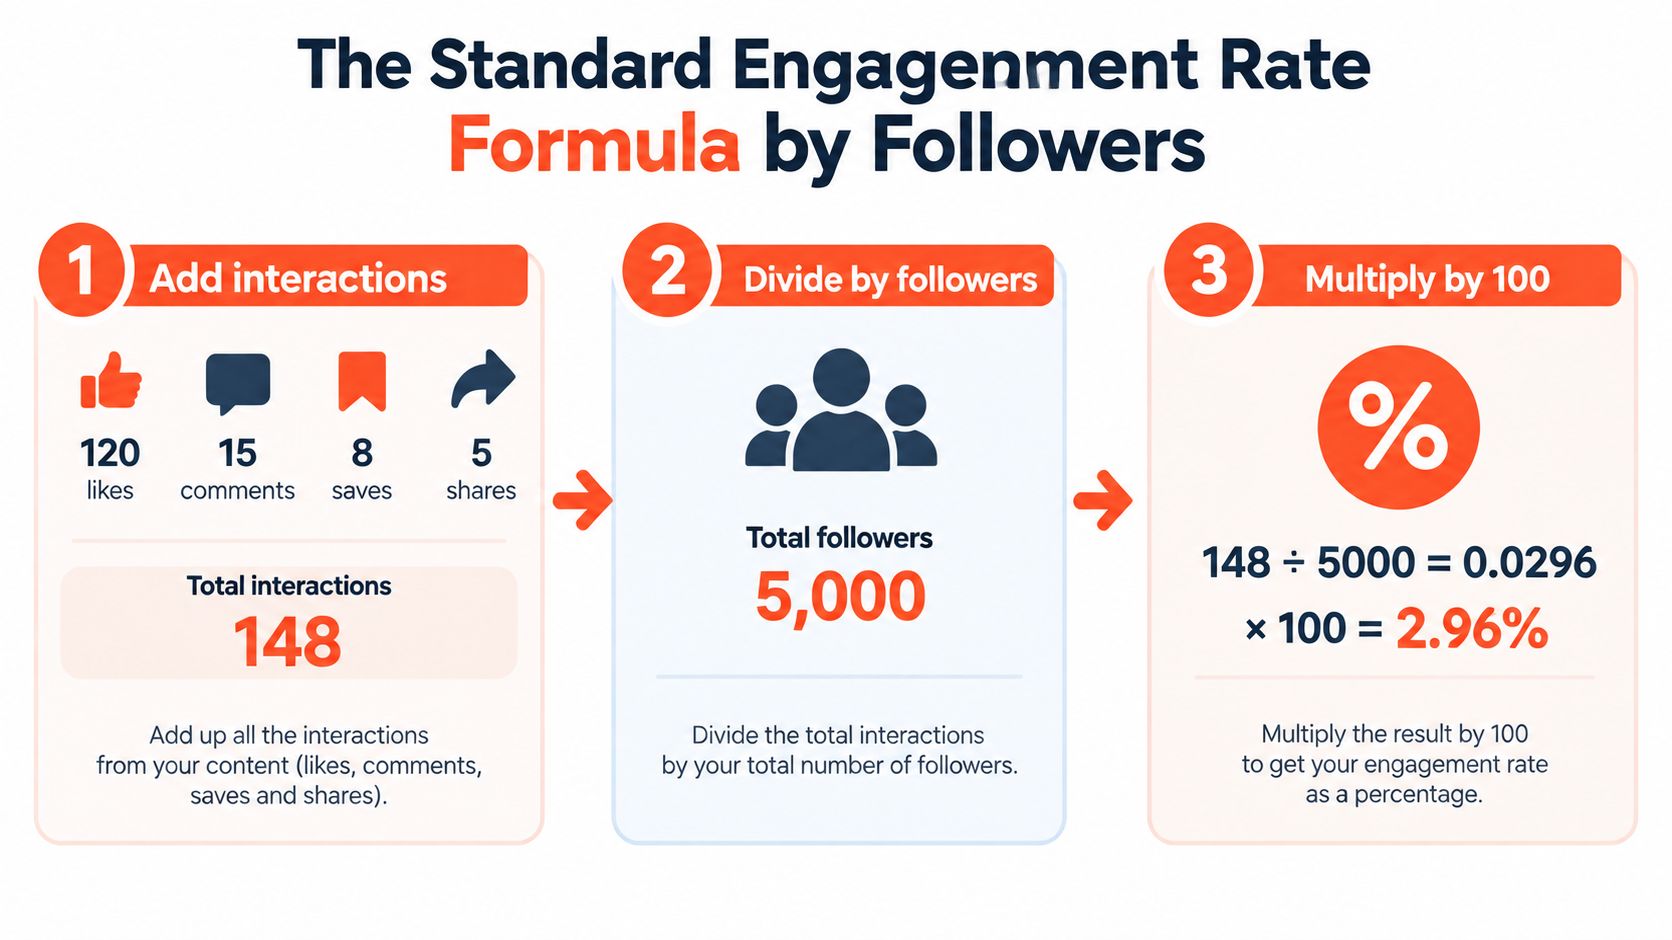
ERF works well for early creator screening because it is easy to explain and available from public information. It puts creators with different audience sizes on a common scale, which helps a sourcing team decide who merits deeper review. It also remains useful when a creator has not shared reach or impression data.
The verified example uses 500 likes, 25 comments, and 50 saves from an account with 10,000 followers, producing 5.75% under the stated follower-based calculation. Use the example to test your spreadsheet before ranking creators.
Define the numerator before comparing results. An older calculator may include only likes and comments, while another report includes saves and shares. Mixing those definitions can distort a shortlist. Add an interaction definition column and specify whether each rate includes likes alone, likes plus comments, or the fuller visible interaction set.
ERF is the practical denominator for public vetting. Use it to screen consistently, then request first-party reach data before making decisions about paid amplification or campaign performance.
Three Alternative Formulas Worth Knowing
The same post can look very different depending on what you put below the dividing line. That isn't a mathematical error. It reflects different business questions.
| Formula | Numerator | Denominator | Result |
|---|---|---|---|
| Engagement Rate by Followers | Total interactions | Followers | Use for creator screening |
| Engagement Rate by Reach | Total interactions | Reach | Use for response among people served |
| Engagement Rate by Impressions | Total interactions | Impressions | Use for exposure and repeat-view analysis |
Engagement Rate by Reach
ERR = total interactions ÷ reach × 100
Reach-based engagement rate is useful when you want to know how strongly the people who encountered the post responded. It's particularly relevant for paid amplification, where distribution may extend beyond the creator's existing follower base.
The verified data describes a creator with a 48,200-follower audience whose Reel generated 7.8% ERF and 12.4% ERR on 25,300 reach. The higher reach-based result doesn't mean the creator suddenly became more engaged. It means the denominator is narrower and closer to the audience that received the content.
Engagement Rate by Impressions
ERI = total interactions ÷ impressions × 100
Impressions count exposure rather than unique people. This makes ERI useful when repeated views matter, such as paid placements where the same audience may encounter content more than once. It's also a practical option for dashboard reporting when impressions are the platform-native delivery metric.
The same verified example records 9.1% ERI on 34,500 impressions. That result should never be placed beside ERF or ERR without labeling the denominator. A spreadsheet that calls all three numbers “engagement rate” invites false conclusions.
Daily engagement rate
A daily variant can normalize activity for creators who post at different frequencies:
Daily engagement rate = average interactions per post ÷ followers × 100 × daily post frequency
This measure can help when comparing a low-volume creator with a high-volume publisher, although it needs careful interpretation. A high posting frequency can increase cumulative audience action while lowering the interaction rate of individual posts. Use it as a supporting view, not as a replacement for post-level analysis.
The right denominator depends on whether you're screening the audience, evaluating content quality, or measuring delivered exposure.
For creator vetting, start with ERF because follower count is usually available publicly. For final campaign decisions, request reach and impression data from recent posts. For paid amplification, ERR or ERI will usually describe delivery more accurately than a follower-based figure.
Averaging Across Multiple Posts Without Getting Fooled
A single post is a fragile basis for a creator decision. Timing, topic, format, audience interest, and distribution can all push one result far above or below the creator's normal level.
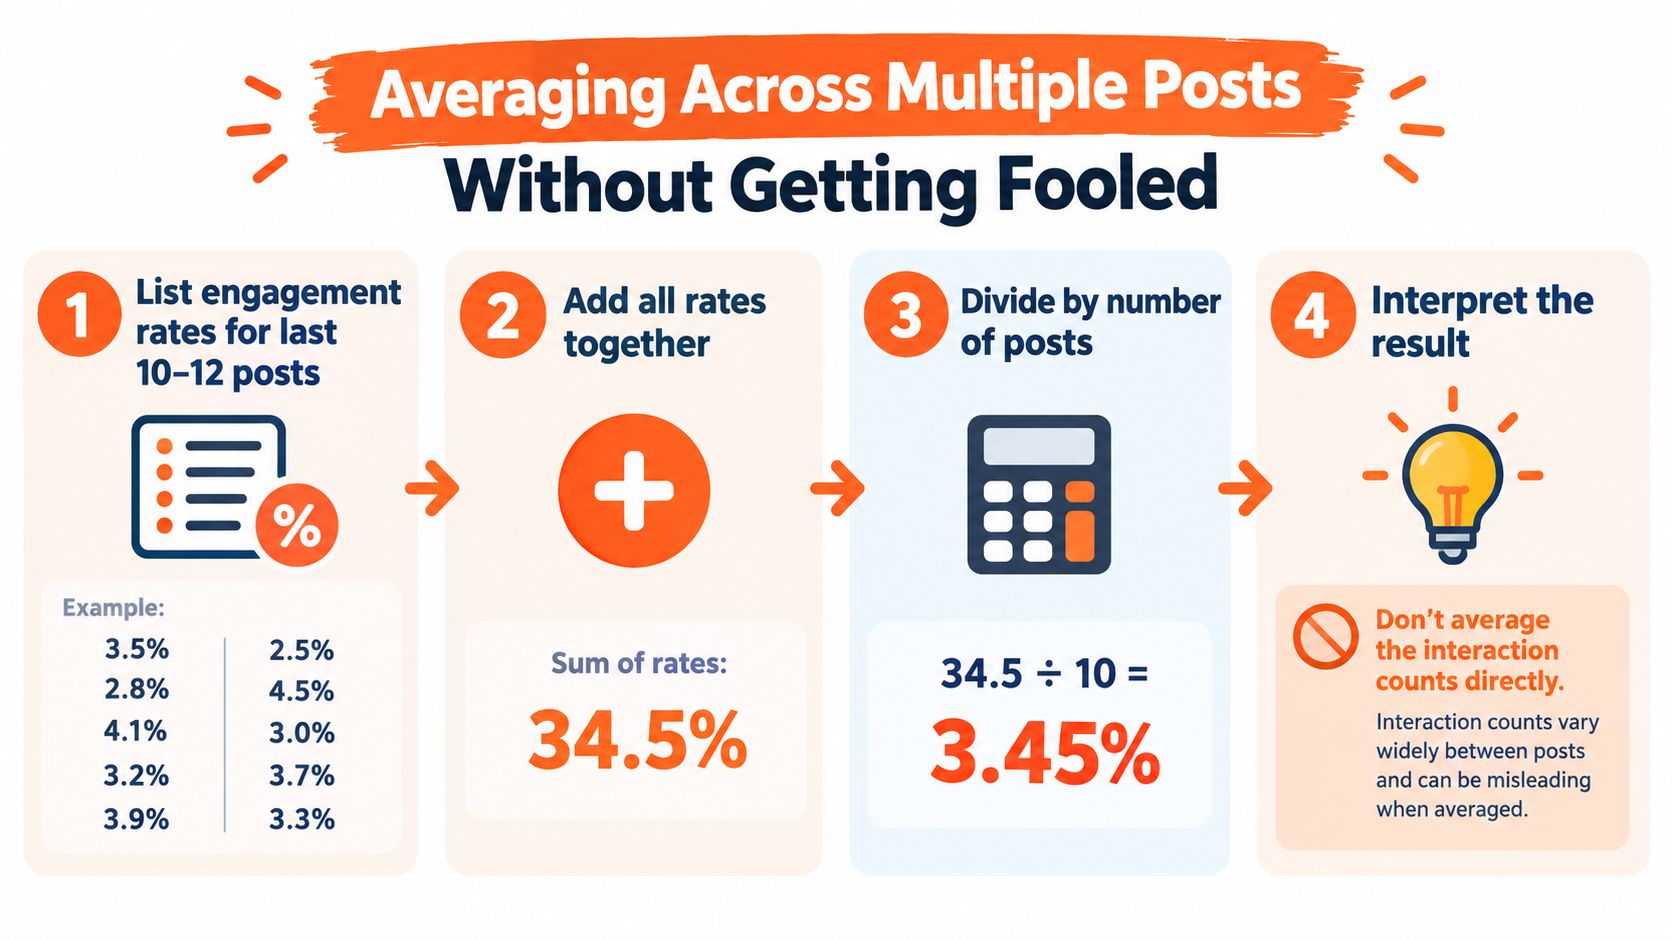
Calculate the rate for each of the creator's recent posts, then average the rates. The supplied infographic uses 10 to 12 posts as the working review set and shows rates of 3.5%, 2.8%, 4.1%, 3.2%, 3.9%, 2.5%, 4.5%, 3.0%, 3.7%, and 3.3%, which add to 34.5% and produce an arithmetic average of 3.45% when divided by 10. Those figures come from the required visual, not an industry benchmark.
Mean versus median
The arithmetic mean is straightforward:
Average engagement rate = sum of post-level engagement rates ÷ number of posts
The weakness is outlier sensitivity. One viral post can pull the mean upward and make a creator look more consistent than they are. A median can provide a safer signal because it identifies the middle result after sorting the post-level rates.
Use both when the decision matters. If the mean is much higher than the median, inspect the posts creating the gap. A viral collaboration, giveaway, celebrity appearance, or unusually broad topic may explain the spike without representing the creator's usual sponsored performance.
Keep formats comparable
Don't combine every format blindly. Reels, feed posts, and Stories have different distribution mechanics and available metrics. Calculate each format separately when you have enough observations, then create a campaign-specific blended view only if the planned deliverables require it.
A workable review sheet includes:
- Post date and format: Record whether the asset was a Reel, feed post, carousel, or Story.
- Interaction set: Keep likes, comments, saves, and shares consistent.
- Denominator: Use followers, reach, impressions, or views consistently within each comparison.
- Outlier flag: Mark posts that were unusually viral, promotional, or unrelated to the creator's normal content.
- Median and mean: Compare both before approving the creator.
Use a rolling multi-post view whenever a single post could change the shortlist.
The minimum review count should rise with account complexity and format variety. For a fast screen, use the recent-post window shown above. For a final decision, request enough content history to distinguish a repeatable pattern from a lucky spike.
The video below gives a visual walkthrough of average engagement-rate calculation. Use it to check the arithmetic, then apply your own agreed interaction definition and denominator.
Benchmarks and What Good Engagement Looks Like in 2026
A benchmark is useful only when the comparison is fair. Follower tier, niche, content format, audience location, and denominator all affect the result. A rate that looks weak under ERF may look healthy under ERR if the post reached a concentrated audience.
The verified benchmark data reports that Instagram's average engagement rate across content types declined from about 0.50% in the first half of 2024 to 0.45% in June 2025, based on a SocialInsider analysis covering 31 million posts from 119,000 pages (the benchmark summary). The same data notes that other 2025 summaries place the platform-wide average around 0.48%, so low single-digit percentages are normal at scale.
Those figures are context, not a pass-fail rule for every creator. A niche creator with a smaller, tightly aligned audience should be evaluated differently from a large entertainment account.
Use thresholds as filters, not verdicts
The requested 2026 tier framework is best treated as a screening model rather than a factual benchmark table, because the verified data doesn't provide tier-specific averages or strong-rate thresholds.
| Follower Tier | Average Rate | Strong Rate | Niche Notes |
|---|---|---|---|
| Nano, under 10K | Not established in verified data | Not established in verified data | Check audience fit and comment quality closely |
| Micro, 10K to 100K | Not established in verified data | Not established in verified data | Compare against similar creators using the same denominator |
| Mid-tier, 100K to 500K | Not established in verified data | Not established in verified data | Review reach efficiency and sponsored history |
| Macro, 500K to 1M | Not established in verified data | Not established in verified data | Lower follower-based rates may be normal at scale |
| Mega, 1M plus | Not established in verified data | Not established in verified data | Prioritize delivered reach, audience quality, and brand fit |
A 2% rate might be a strong result for one large fashion account and a disappointing result for a highly focused fitness creator. Beauty, food, gaming, B2B, and fashion also produce different interaction patterns, so compare within a relevant peer set rather than applying one universal cutoff.
Look for pattern breaks
The most useful red flags are often visible before you calculate a final score:
- Engagement cliffs: Recent posts suddenly perform far below the creator's established pattern.
- Low-quality comments: Repeated emoji-only comments or generic replies don't prove fraud, but they warrant an audience-quality review.
- Format dependence: A creator may look strong on Reels while weak on the format you're buying.
- Denominator collapse: A reach-based result can change sharply when you remove Stories or separate paid distribution from organic delivery.
For campaign economics, engagement is only one input. Influencer marketing ROI measurement guidance helps place the rate alongside attribution and outcome metrics rather than treating it as a proxy for revenue.
Common Calculation Mistakes That Skew Your Numbers
The most damaging spreadsheet error is mixing formulas in the same column. A nano creator's follower-based rate cannot be fairly ranked against a macro creator's reach-based rate, even if both cells are labeled “Instagram ER.” The numbers may be accurate individually and still produce a misleading comparison.
A typical vetting report might list likes and comments for one creator, total interactions including saves and shares for another, and reach-based results for a third. That report needs to be rebuilt before anyone uses it for negotiation or selection.
The errors that appear most often
- Dropping saves and shares: A likes-only numerator can understate useful audience action. Agree on the interaction set before collecting data.
- Using today's follower count: Match the follower snapshot to the post date as closely as the available data allows.
- Ignoring format differences: Reels, feed posts, and Stories can't always be interpreted through the same performance lens.
- Trusting the verification badge: A verified badge doesn't establish that the full audience is active or relevant.
- Averaging raw counts: Average the post-level rates when that's the agreed method. Don't mix average interactions with a different follower snapshot without documenting it.
Consider two creators shortlisted for the same product launch. The smaller creator has a higher ERF calculated from recent posts, while the larger creator has a higher ERR because the content reaches people beyond the existing follower base. Neither ranking is automatically correct. The campaign objective decides whether existing-audience response or delivered-audience response matters more.
Run this quick pre-report check:
- Confirm every row uses the same numerator definition.
- Confirm the denominator is labeled in the column name.
- Check that follower counts match the relevant posting period.
- Separate organic, paid, and cross-posted distribution.
- Compare the mean with the median before making a recommendation.
If the report passes those checks, the number is much easier to defend. If it doesn't, precision in the decimal places won't rescue the analysis.
Choosing the Right Formula Before Your Next Campaign
Formula selection should follow the campaign stage.
For initial creator sourcing, use follower-based ERF across a consistent recent-post sample. It's fast, explainable, and practical for screening a large pool when private reach data isn't available. Keep the interaction definition consistent and record the source date for every profile.
For final shortlisting and negotiation, ask for recent Insights data and move toward reach-based or impression-based rates. These denominators tell you whether the creator's content generates action among people who received it, not just among the account's total follower base.
For post-campaign reporting, choose the denominator that matches the agreed reporting objective. Follower-based rates support historical and peer comparisons, while reach and impressions explain delivery quality. Video-first placements may also need a views-based measure.
A simple selection checklist
- Sourcing: Use ERF for fast, comparable public screening.
- Shortlisting: Validate ERR or ERI with recent private Insights.
- Paid amplification: Prefer the denominator that reflects the audience served.
- Video optimization: Add views-based analysis when views drive the placement.
- Reporting: Document the formula, interaction set, date range, and denominator.
A large difference between follower-based and reach-based results isn't automatically suspicious. It can reflect efficient distribution, paid amplification, or a post that traveled beyond the creator's audience. It should, however, trigger an explanation before you approve the partnership.
Write the formula beside every reported percentage. A label such as ERF, likes plus comments plus saves plus shares, divided by followers is far more useful than a cell labeled “engagement rate.” A dedicated influencer marketing ROI calculator can help standardize the broader measurement workflow, but your team still needs to define the denominator before entering the data.
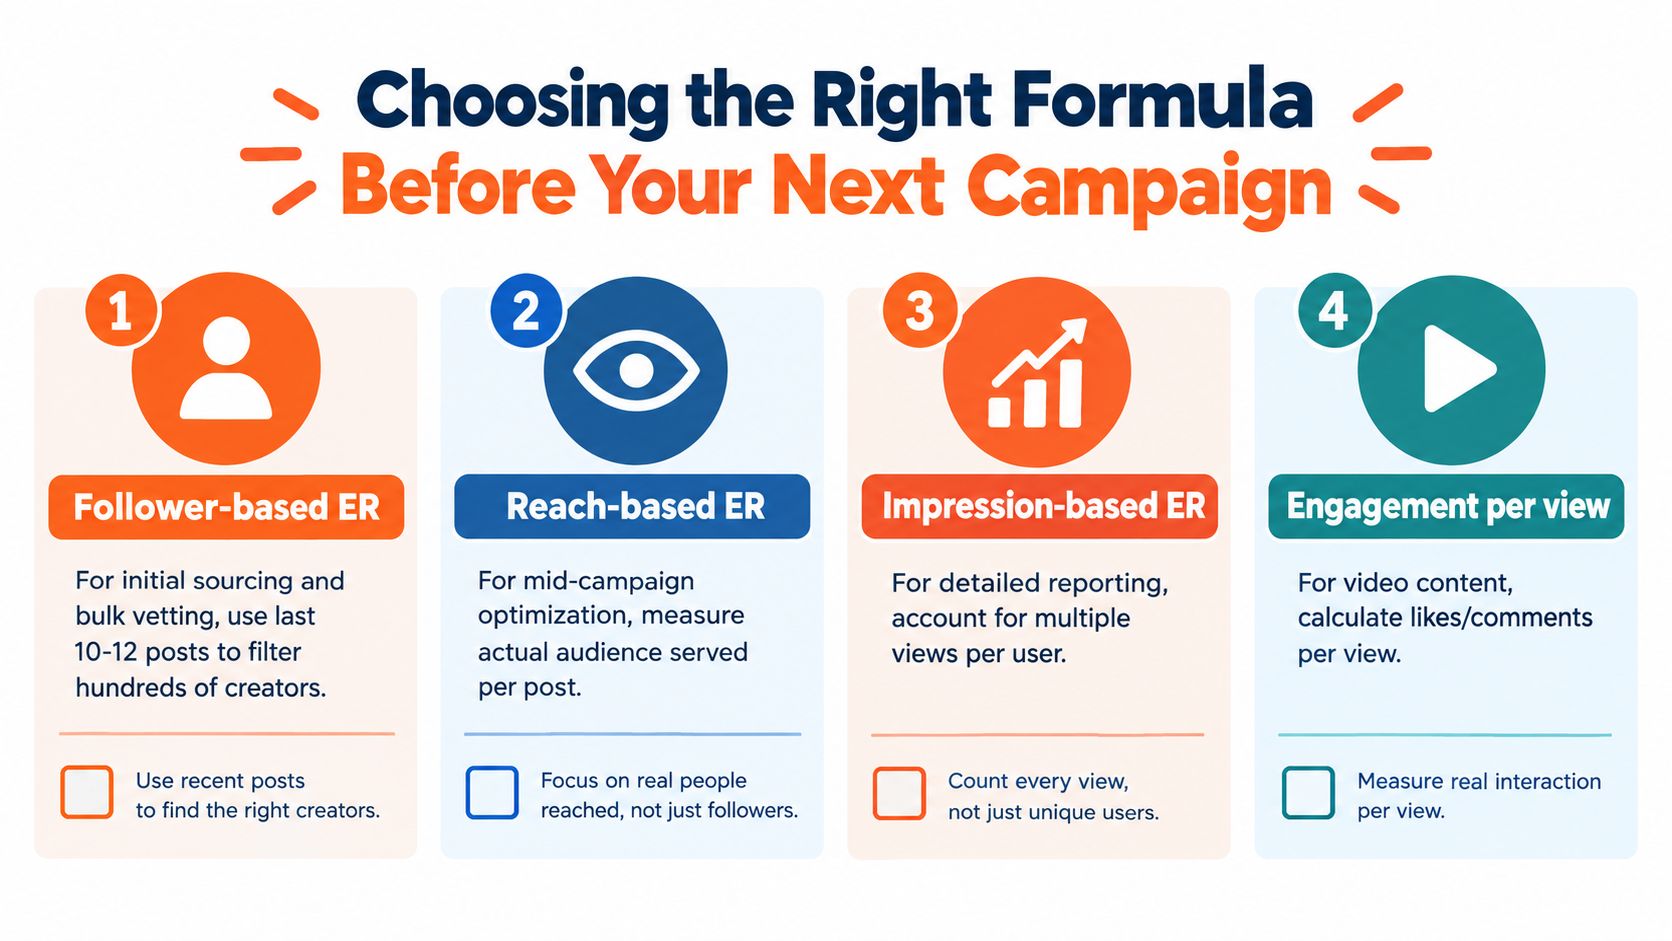
The best weekly shortcut is simple: screen with ERF, validate finalists with reach or impressions, and report the result with the formula written next to it. That process keeps creator rankings consistent and makes disagreements about performance easier to diagnose.
Social Cloud helps growth teams select vetted creators, forecast campaign delivery, manage execution, and connect every placement to measurable outcomes through tracking links, promo codes, and reporting. Visit Social Cloud to build a creator shortlist around audience quality, campaign objectives, and accountable performance rather than follower count alone.