

Impressions are easy to celebrate because they look impressive in a dashboard. They're much harder to defend when finance asks a simpler question: what did this creator cause that wouldn't have happened anyway? A post can generate reach, comments, clicks, and promo-code redemptions while producing little or no incremental demand.
That doesn't make awareness or engagement useless. It means you need to separate reported activity from caused outcomes, then choose influencer marketing KPIs that match the job the campaign is meant to do. The framework below moves from awareness to efficiency, while treating attribution limits, testing quality, and disclosure compliance as part of performance measurement rather than footnotes.
Table of Contents
Why Most Influencer Marketing KPI Reports Miss the Point
Most KPI reports answer the easiest question: what did the platform record? They show impressions, views, likes, comments, clicks, and perhaps revenue assigned to a tracking link. The difficult question, whether the creator changed customer behavior, often remains unanswered.
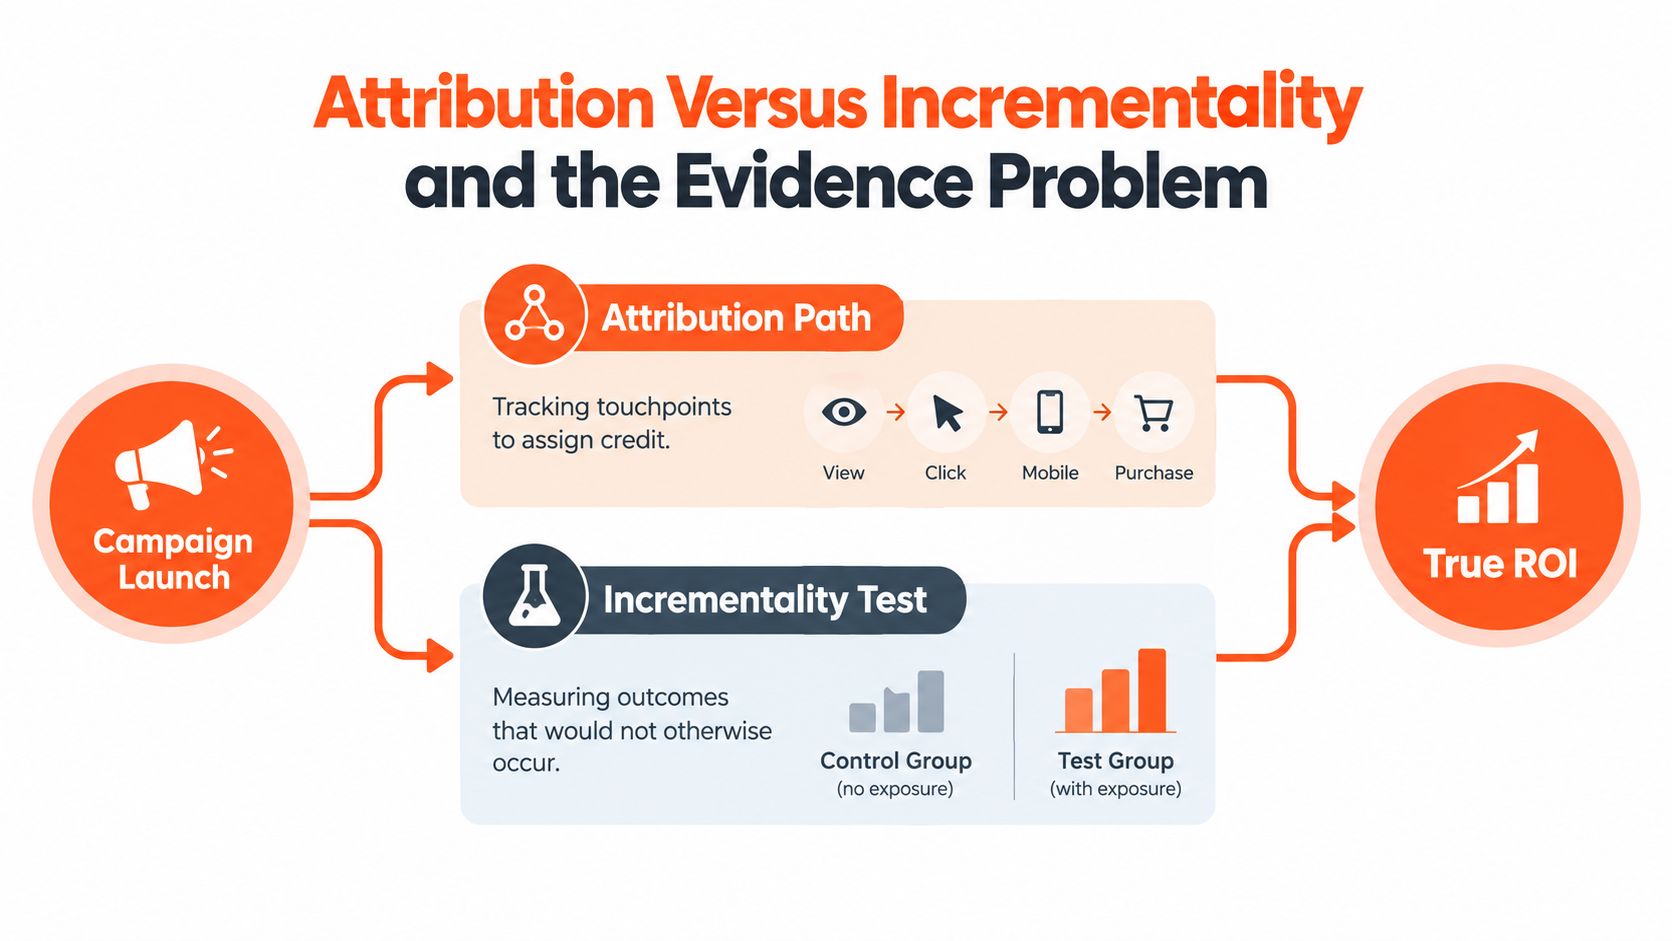
That distinction matters because attribution assigns credit to a tracked touchpoint, while incrementality asks whether the campaign caused an outcome that wouldn't otherwise have occurred. A last-click link can credit a creator for a customer who had already decided to buy. A promo code can capture existing demand from someone who was already searching for the brand. A platform pixel can claim a conversion without proving that the creator created the conversion.
The result is a familiar reporting failure. The marketing team presents a healthy ROAS figure, while the finance team sees no clear evidence that the spend generated additional revenue. Both teams may be looking at accurate numbers. They're answering different questions.
Practical rule: Never let a tracked conversion stand in for an incremental conversion unless the campaign design supports that conclusion.
The vanity metric trap
Reach and engagement still have a role, especially when the campaign is designed to introduce a product, test creative, or build consideration. The mistake is promoting them to primary success measures for every objective.
A useful KPI system pairs leading indicators with outcome measures:
- Leading indicators: Watch-through, saves, branded-search lift, and product-page lift can show whether attention and consideration are developing.
- Outcome measures: Incremental conversions, new-customer rate, contribution margin, payback period, and retention connect activity to commercial value.
- Evidence quality: Holdout audiences, geo-experiments, conversion-lift tests, post-purchase surveys, and triangulation across links and codes help determine whether the outcome was caused by the campaign.
Benchmark coverage also shows why awareness figures can dominate reports even when revenue proof is weak. One 2025 influencer marketing benchmark reports awareness selected by 89% of respondents, compared with 35% for conversions and 25% for attributable revenue or sales.
Why pricing makes this urgent
Outcome-linked fees turn measurement quality into a contract issue. If a creator or agency is paid for conversions, revenue, profit, or qualified acquisition, both sides need to define the eligible outcome before launch.
That definition should cover the attribution window, exclusions for existing customers, treatment of returns, duplicate conversions, self-reported discovery, and whether platform-reported credit is sufficient. Without those rules, a performance fee can reward capture of demand rather than creation of demand.
The genuine KPI question isn't “which numbers can we put in the report?” It's what evidence is strong enough to claim the creator caused the result?
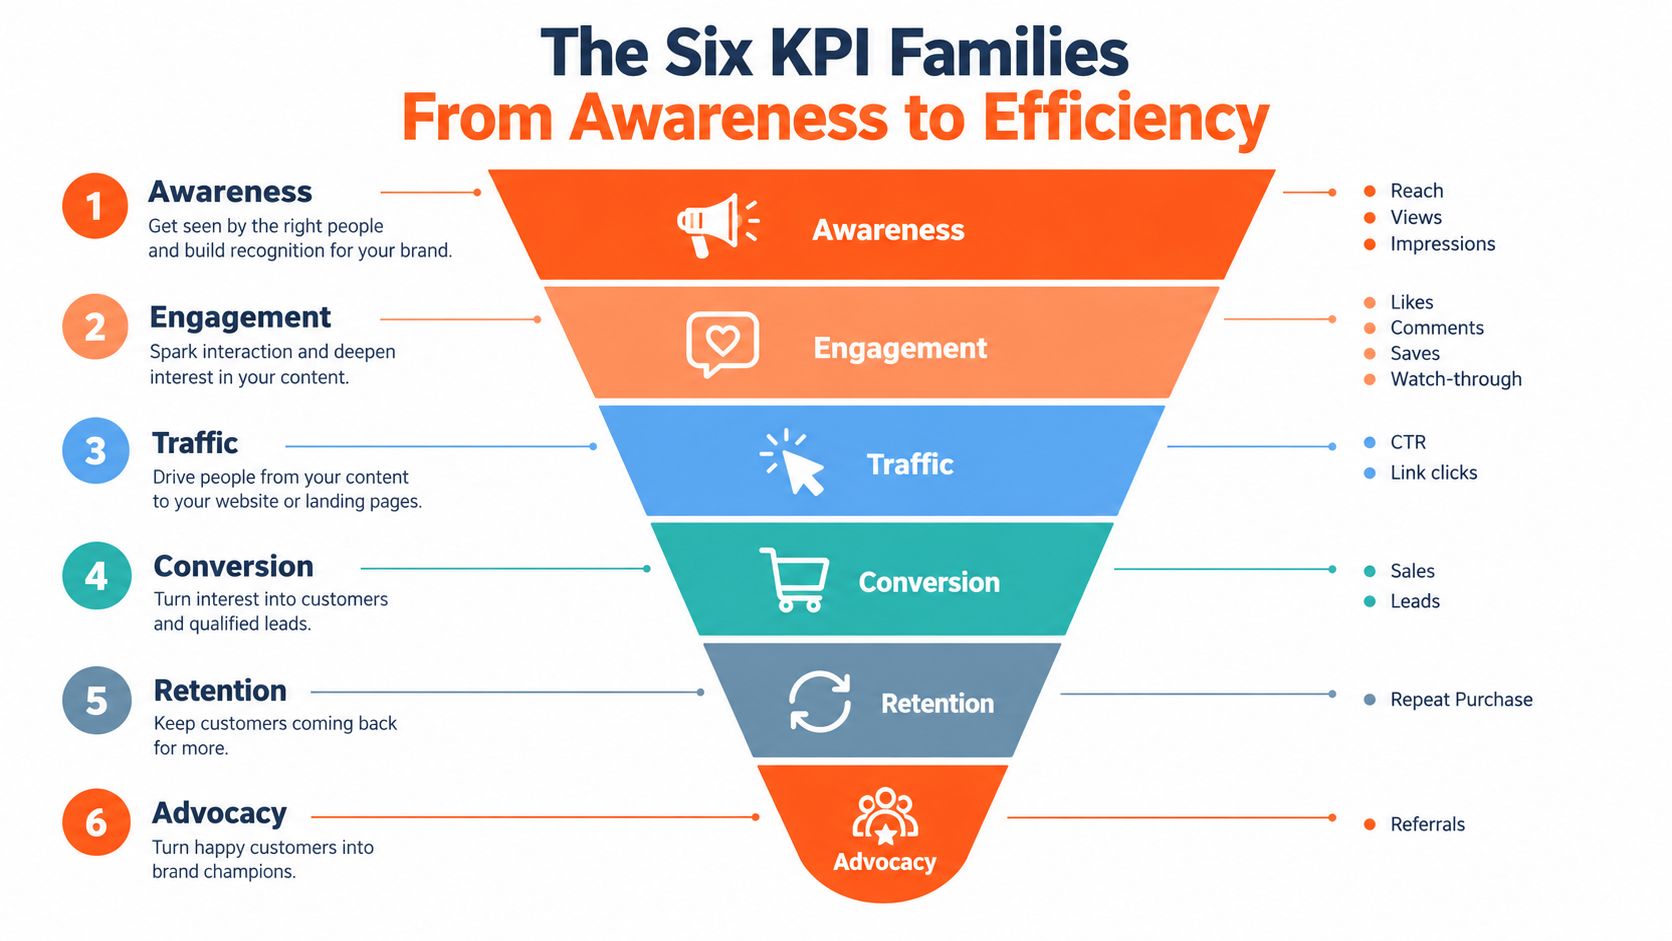
The Six KPI Families From Awareness to Efficiency
A funnel gives teams a useful map, but it shouldn't imply that every campaign moves neatly from one stage to the next. A Twitch stream may generate direct conversions without producing a large impression count. A YouTube review may influence a purchase days later, outside the last-click window. The six families are best treated as different lenses on the same customer journey.
Awareness and engagement
Awareness includes reach, views, and impressions. Reach estimates how many unique people encountered the content. Views and impressions describe exposure volume, but they can include repeat consumption and don't reveal whether the audience was relevant.
Engagement includes likes, comments, saves, shares, and watch-through. These actions offer stronger clues about attention than exposure alone, but comparisons become unreliable across formats. A save on Instagram, a completed YouTube view, and a Twitch chat interaction represent different behaviors. They shouldn't be collapsed into one universal engagement score without a clear weighting model.
Traffic and conversion
Traffic covers link clicks and click-through rate. It tells you whether the content motivated a next step, not whether the landing page or product convinced the visitor. A strong CTR with weak conversion usually points to a mismatch between the promise in the content and the destination experience.
Conversion includes purchases, leads, installs, registrations, or another defined action. This is closer to business value, but conversion numbers still depend on tracking quality, attribution windows, customer mix, and existing demand.
For a channel-specific view of purchase behavior, TikTok Shop KPIs that matter is a useful complement to generic influencer dashboards because the platform's commerce context changes which signals deserve attention.
Revenue and efficiency
Revenue metrics include attributable sales, attributable revenue, and ROAS. They're useful for operational decisions, especially when every creator receives a distinct link or code. They become misleading when teams present attributed revenue as incremental revenue.
Efficiency metrics include CPM, CPI, CPA, and CAC. These answer what the campaign paid for each unit of exposure, install, conversion, or acquired customer. Efficiency is only meaningful when the denominator has a consistent definition. A low CPA based on repeat customers may be less valuable than a higher CPA that brings in profitable new customers.
| KPI family | Typical signals | What it tells you | Where it can mislead |
|---|---|---|---|
| Awareness | Reach, views, impressions | Exposure volume and distribution | Doesn't prove attention or demand |
| Engagement | Likes, comments, saves, watch-through | Audience response and content resonance | Platform formats aren't directly comparable |
| Traffic | CTR, link clicks | Intent to investigate | Clicks can be curious, accidental, or low quality |
| Conversion | Purchases, installs, leads | Completion of a defined action | Tracking may over-credit the creator |
| Revenue | Attributable sales, ROAS | Commercial value assigned to placements | Assigned value isn't automatically incremental |
| Efficiency | CPM, CPI, CPA, CAC | Cost per measured result | The result may have inconsistent quality |
A sound brief usually includes at least one leading indicator and one outcome metric. That pairing shows both whether the creative is working and whether the activity is producing the business result the campaign was built to deliver.
Formulas and Platform Quirks for YouTube, Instagram, TikTok, and Twitch
The arithmetic is simple. The interpretation isn't. Before calculating anything, define the denominator, attribution window, event, and platform scope. Otherwise, two teams can report different results from the same placement and both claim they used the correct formula.
Core formulas
- Engagement rate: engagements ÷ reach. If a post receives 420 engagements from 10,000 reached users, the rate is 4.2%.
- CTR: clicks ÷ impressions. If a placement records 180 clicks from 12,000 impressions, CTR is 1.5%.
- Conversion rate: conversions ÷ clicks. If 18 purchases follow 180 clicks, the conversion rate is 10%.
- CPI: spend ÷ installs. If a campaign costs $2,400 and produces 300 tracked installs, CPI is $8.
- CPA: spend ÷ conversions. If spend is $3,000 and the campaign records 75 conversions, CPA is $40.
- ROAS: attributed revenue ÷ spend. If attributed revenue is $9,000 against $3,000 in spend, ROAS is 3.
Those examples are calculations, not benchmarks. They become decision-ready only after you define whether the events are new customers, qualified leads, completed registrations, or another agreed action.
For a deeper explanation of the Instagram denominator question, see how to calculate engagement rate on Instagram. Reach-based calculations can be more useful for post-level analysis than follower-based calculations, but consistency matters more than choosing a fashionable formula.
Platform interpretation
YouTube rewards attention that lasts. Views alone won't tell you whether the integration held interest, so watch-through, average view duration, clicks, and conversions should be read together. A high view count with weak watch-through can indicate that the opening attracted attention but the sponsored segment failed to sustain it.
Instagram separates behavior across formats. Reels, Stories, feed posts, and profile visits expose different combinations of reach, plays, replies, taps, and link actions. Don't compare a Story link CTR with a Reel engagement rate as if they measure the same stage of the journey.
TikTok can produce rapid bursts of distribution, which makes timing and early response useful operational signals. First-day CTR can help identify whether a hook is creating action while the post is receiving attention, but it still doesn't prove that later conversions were incremental.
Twitch is a live environment. Concurrent viewers, chat activity, stream retention, clicks, and affiliate-link conversions may matter more than a static impression count. The format also creates delayed behavior, since viewers can hear a recommendation during a stream and act later.
| KPI | Formula | Best-fit platform signal |
|---|---|---|
| Engagement rate | Engagements ÷ reach | Instagram reach-based interaction |
| CTR | Clicks ÷ impressions | TikTok and Instagram link response |
| Watch-through | Viewers reaching a defined point ÷ viewers started | YouTube video attention |
| CPI | Spend ÷ installs | TikTok, YouTube, and app-focused creator placements |
| CPA | Spend ÷ conversions | Direct-response campaigns across platforms |
| ROAS | Attributed revenue ÷ spend | Commerce campaigns with verified tracking |
Use platform dashboards for diagnostic data, then reconcile them with analytics, affiliate systems, app events, and post-purchase feedback. The dashboard tells you what the platform observed. Your measurement system must establish what the business received.
Matching KPIs to Your Business Objective
The right KPI depends on the decision you're trying to make. A brand-lift campaign judged on CPA may look inefficient even when it improves consideration. A SaaS demand-generation campaign judged on immediate ROAS may undervalue leads that need sales qualification before producing revenue.
Choose the primary metric before the creator brief, not after the first report. Set the event definition, target range, secondary diagnostic, and evidence standard alongside the forecast.
Brand lift
For awareness and consideration, use reach as a distribution measure, then pair it with watch-through, branded-search lift, or product-page lift. Those signals help answer whether people noticed the message and showed some follow-on interest.
Engagement can diagnose creative quality, particularly saves, shares, comments, and viewing behavior. It shouldn't replace evidence of brand movement. A funny post can earn attention without improving product consideration.
App installs
An app campaign needs more than a cheap install. Track CPI, install-to-registration rate, and retention. If the creator attracts downloads from people who never complete onboarding, the apparent acquisition efficiency hides weak audience quality.
The event hierarchy should be agreed before launch. For one app, a completed registration may be the useful conversion. For another, it may be a subscription start or a qualified in-app action.
E-commerce purchases
For commerce, track attributable revenue and ROAS, then add new-customer rate, contribution margin, and payback period. Revenue without margin can encourage the team to scale placements that lose money after discounts, fulfilment, returns, and creator fees.
A promo code is useful for identifying behavior, but don't treat every redemption as a new sale created by the creator. Separate existing customers from first-time buyers and review repeat purchase behavior before increasing spend.
Lead generation
Lead-gen teams should prioritize cost per qualified lead and payback period. A cheap form completion can be a poor result if sales rejects the lead, the account lacks buying potential, or the pipeline takes too long to recover acquisition cost.
A practical decision filter looks like this:
- Define the business outcome: Awareness, install, purchase, or qualified lead.
- Select one primary KPI: Make it the metric that determines whether budget should continue.
- Add a leading indicator: Use watch-through, saves, CTR, or product-page lift to diagnose creative performance.
- Choose an evidence level: Decide whether links and codes are enough or whether you need surveys, holdouts, or geo-testing.
- Set quality conditions: Include new-customer status, margin, retention, qualification, or compliance where relevant.
The broader metrics that move the needle discussion is useful here because it reinforces a practical principle: a metric earns priority when it changes a budget or creative decision.
Attribution Versus Incrementality and the Evidence Problem
A tracked sale is not automatically an incremental sale. Attribution records a relationship between a customer and a touchpoint. Incrementality estimates the difference between what happened with the campaign and what would have happened without it.
That difference is easy to miss in creator campaigns. A customer may see a creator's content, search for the brand, find a retargeting ad, and then use the creator's code. The code receives credit, but the campaign may have influenced the journey in a way that last click cannot represent. The opposite can also happen. The customer may already be ready to buy, and the code captures demand that existed before the placement.
Upgrade the evidence gradually
Start with single-source tracking. Give each creator a unique URL, code, landing page, or app event path. This is operationally necessary, but it remains vulnerable to cookie loss, cross-device behavior, untracked discovery, and demand capture.
Add triangulation by comparing links, codes, platform reporting, analytics, and post-purchase surveys. If customers report the creator as their discovery source but don't use the code, the survey can reveal influence that last-click tracking missed. If the code reports sales but surveys show existing brand familiarity, the code may be overstating new demand.
Move to stronger designs when the budget or decision warrants it:
- Holdout audiences: Keep a comparable audience from receiving the creator exposure and compare outcomes.
- Geo-experiments: Activate creators in selected regions and compare changes with similar regions that didn't receive the campaign.
- Conversion-lift tests: Use a platform or analytics setup designed to estimate whether exposed audiences converted at a higher rate than comparable unexposed audiences.
- Post-purchase surveys: Ask how the customer discovered the product, then connect responses to order and customer-status data.
The evidence ladder matters more than the dashboard polish. A clean last-click report can be less trustworthy than a messy report that clearly states what it can and can't prove.
The outcome measures that withstand scrutiny are incremental conversions, new-customer rate, contribution margin, payback period, and retention. Those measures force the team to look past the first transaction and assess the quality of the acquired customer.
Before agreeing to an outcome-linked fee, define what counts as incremental. The contract should specify whether a conversion must be new, whether organic demand is excluded, how duplicate touchpoints are handled, and which measurement method settles disagreements. A practical guide to measuring influencer marketing ROI can help teams organize the tracking layer, but no tracking link can answer an incrementality question on its own.
A short visual explanation can also help stakeholders understand why assigned credit and causal impact are different:
Tracking Disclosure Compliance as a Performance KPI
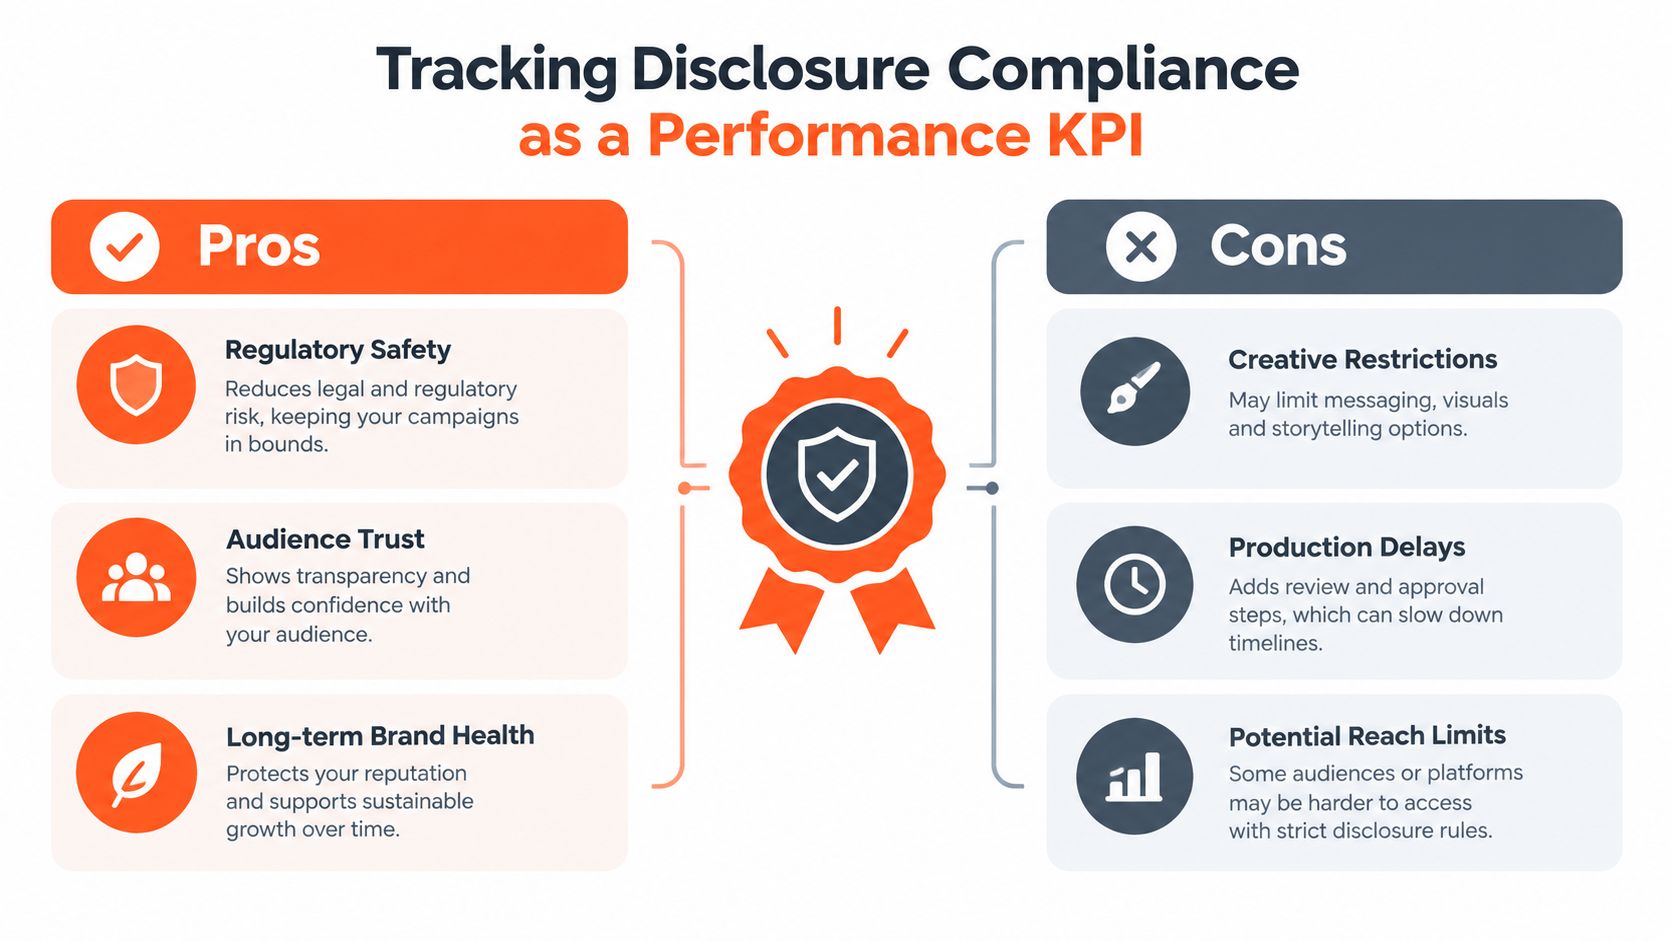
Compliance usually appears in a legal checklist, separated from the performance report. That separation creates a measurement blind spot. Clear disclosure can affect trust, engagement, comparability, brand risk, and whether the brand can safely reuse a creator asset in paid amplification.
The European Union's 2024 sweep found that 97% of reviewed influencers published commercial content, while only about 20% systematically identified it as advertising, according to the European Parliament briefing on influencer marketing and consumer protection. That gap makes disclosure more than a box-ticking exercise. It creates a measurable operating issue for every campaign manager responsible for approvals, corrections, and asset rights.
Build a compliance scorecard
Track compliance at creator and asset level, not only as a campaign-wide pass or fail:
- Disclosure-compliance rate: The share of published assets using the required disclosure language or platform label.
- Time-to-correction: The time between identifying a mislabeled post and confirming the correction.
- Platform-label usage: Whether the platform's paid-partnership or commercial-content label was applied correctly.
- Performance by disclosure status: Engagement and conversion differences between properly labeled and noncompliant assets.
- Amplification eligibility: The share of creator assets legally cleared for paid reuse, including formats such as Spark Ads.
- Risk context: Sector, market, claims language, approvals, and whether the asset can remain live without exposing the brand to avoidable risk.
A compliant post may show a different short-term CTR from an unlabeled post. That doesn't automatically make the unlabeled version better. A clear disclosure can preserve trust, reduce regulatory exposure, improve reporting comparability, and protect the brand's ability to reuse the asset.
Measure the trade-off honestly
For fintech, health, and SaaS, performance reporting should place conversion efficiency beside compliance quality. A post that generates immediate clicks but requires removal, correction, or legal review can create operational costs that never appear in ROAS.
The useful question is not whether disclosure hurts performance in every case. It's whether the campaign has measured the full value of safe, transparent, reusable creative. That requires joining media results with approval status, correction history, rights clearance, and downstream amplification.
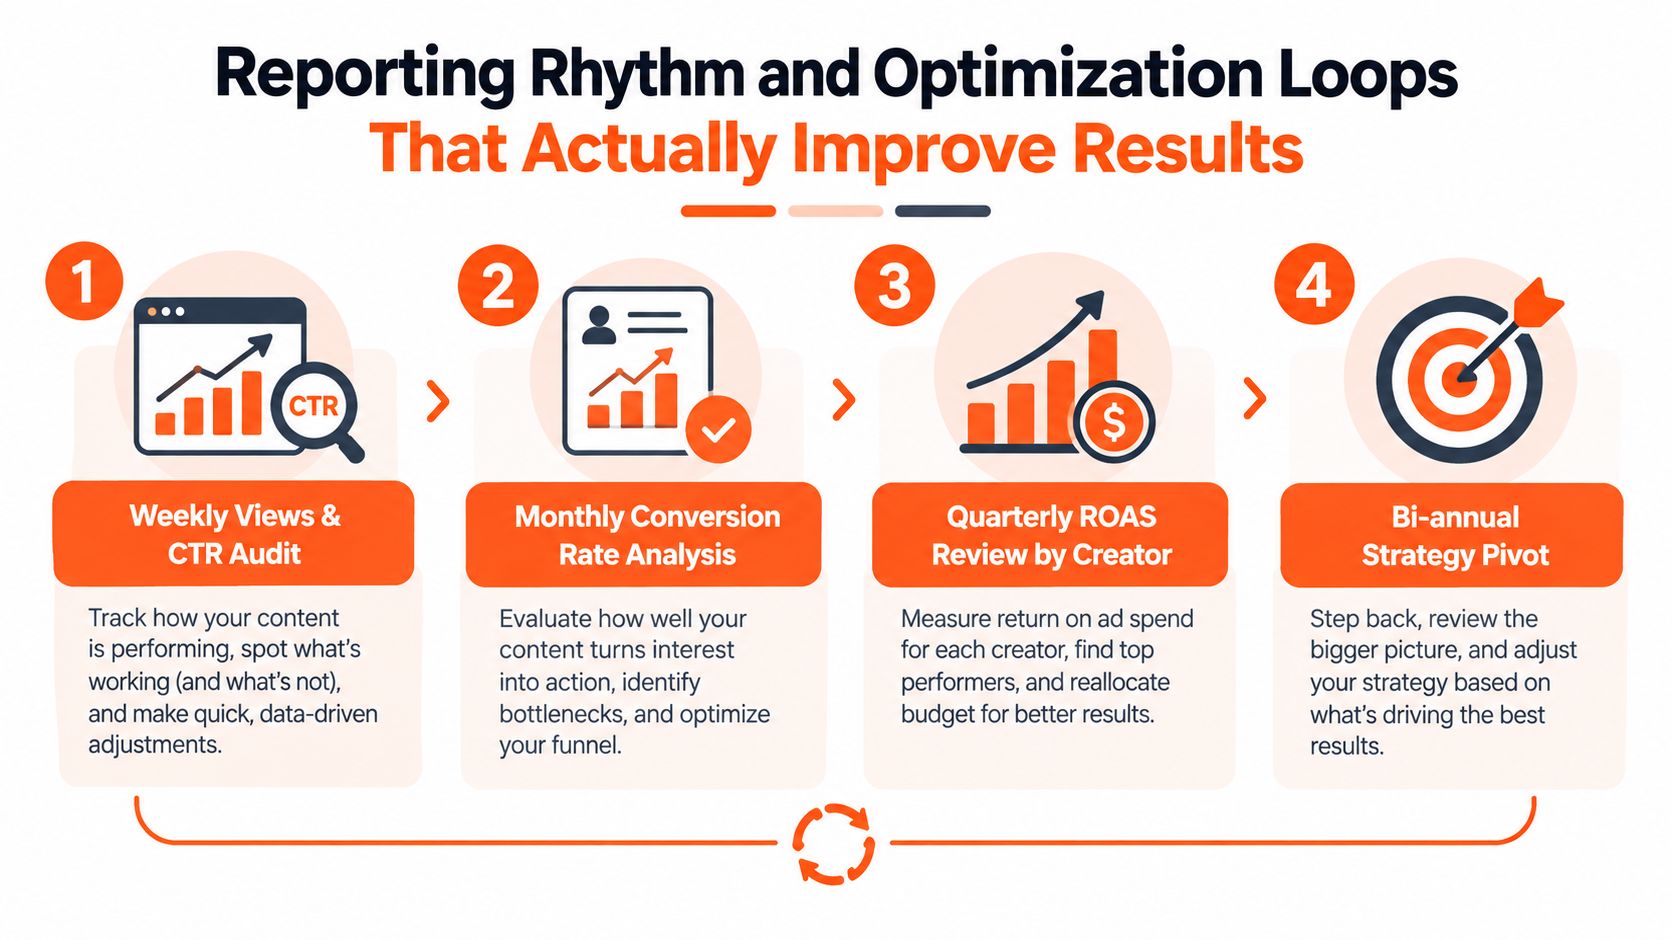
Reporting Rhythm and Optimization Loops That Actually Improve Results
A report should help someone decide what to change. If it only summarizes what happened, it's a record, not an optimization system.
Start with a weekly view broken down by creator and platform, not just campaign totals. Review views, CTR, conversions, and ROAS alongside the content format, hook, audience quality, disclosure status, and landing-page destination. The campaign total can hide a strong placement behind several weak ones, or make a single outlier look repeatable.
Use a learning log
Capture observations in a format the next brief can use:
- Creative pattern: Which opening, proof point, product demonstration, or call to action held attention?
- Audience signal: Did clicks come from new prospects, existing customers, or low-quality traffic?
- Funnel break: Did the problem occur at view, click, registration, purchase, or repeat use?
- Creator context: Was the result linked to audience fit, format, timing, offer, or delivery?
- Evidence quality: Was the result based on a code, link, survey, holdout, or several signals together?
Run a monthly conversion review to identify whether the strongest CTR placements also produce qualified outcomes. Review ROAS by creator rather than treating the channel as one pool. Use longer-term retention and payback analysis when the business outcome takes time to mature.
A practical reporting template can follow the structure in this influencer marketing report guide, then add the incrementality and disclosure fields that most standard templates omit.
Lock the rules before launch
Outcome-linked operating models work only when the measurement terms are agreed in advance. Set target CPI or CPA before spend, define eligible conversions, establish how creator budgets are passed through, and specify which signals will trigger optimization or pause decisions.
For teams that need an end-to-end operating partner, Social Cloud plans and measures creator campaigns across YouTube, Instagram, TikTok, and Twitch, using tracking links, promo codes, and post-purchase surveys alongside weekly reporting for views, CTR, conversions, and ROAS. Treat that type of service as one option among other agency, platform, or in-house approaches, and evaluate it against the evidence standard your campaign requires.
Use this kickoff checklist:
- Write the objective: State the business outcome in one sentence.
- Choose the primary KPI: Make one metric responsible for the budget decision.
- Add a leading signal: Select the behavior that diagnoses creative performance.
- Define attribution: Assign links, codes, events, and survey questions by creator.
- Set the evidence level: Decide whether you need triangulation, holdouts, geo-tests, or lift testing.
- Add quality controls: Include new-customer status, margin, retention, lead qualification, and disclosure compliance.
- Schedule the review: Assign owners for weekly diagnostics and deeper outcome analysis.
If your creator reports stop at reach, clicks, and platform-attributed ROAS, Social Cloud can help you build per-placement tracking, outcome-linked campaign definitions, weekly optimization reports, and disclosure workflows across YouTube, Instagram, TikTok, and Twitch. Visit Social Cloud to discuss a measurement framework tied to the business outcome you need to prove.