

Most influencer marketing reports are still built to make campaigns look busy, not to prove they made money. Impressions, likes, and follower growth have their place, but they can't answer the question a performance team faces: did creator activity generate incremental revenue at an acceptable cost?
The market's expansion explains why this distinction matters. The global influencer marketing market grew from about $1.7 billion in 2016 to roughly $32.55 billion in 2025, nearly 19 times larger over that period, according to industry market data from Technology Checker. As creator partnerships become a serious media investment, reporting needs to mature from a post-campaign recap into an operating system for budget, creative, and attribution decisions.
Table of Contents
Why Vanity Metrics Are Killing Your Campaigns
A report can show millions of impressions and still fail the only question that matters to a growth team: did creator activity produce additional profitable demand? Reach, likes, and follower growth describe exposure. They do not establish that a creator caused a purchase, justified a renewal, or deserves a larger share of budget.
Follower count is a distribution input, not a value forecast. Engagement has the same limitation. A high rate may reflect entertaining content from an audience with little product interest, while a quieter creator may reach buyers who convert later through search, email, direct traffic, or branded retargeting. Revenue also needs context. Without total cost, refunds, repeat purchase behavior, and a credible counterfactual, tracked sales can create false confidence.
The dashboard problem
Vanity metrics become harmful when the dashboard gives them the largest tiles and the most meeting time. Keep them as diagnostic signals. Reach can expose distribution problems, watch-through can reveal creative fatigue, and comments can surface objections. None should replace an outcome measure.
Practical rule: If a metric cannot change a budget, creator, offer, or creative decision, keep it out of the report's top tier.
Use one engagement formula across the program. Teams can review how to calculate engagement rate on Instagram, then record the chosen numerator, denominator, platform fields, and reporting window in the measurement specification. A shift from follower-based to reach-based engagement can manufacture a trend without any change in audience response.
A stronger dashboard separates three layers:
- Delivery: reach, impressions, frequency, views, and watch-through.
- Behavior: clicks, landing-page sessions, code use, signups, and assisted visits.
- Business outcome: incremental orders, contribution margin, customer quality, and payback.
Replace attention with accountability
Influencer programs now sit beside paid search, affiliates, email, and retargeting. Reporting should therefore connect creator activity to conversions, sales, and lifetime value, rather than treating awareness as the final result, as described in the market overview from Technology Checker.
Add incrementality testing wherever the program can support it. Hold out comparable audiences, creators, geographies, or time periods, then compare outcomes with the exposed group. The result will not remove every attribution flaw, but it can show whether tracked demand exceeded the baseline.
Post-purchase surveys provide another useful check. Ask customers how they heard about the brand and compare those responses with platform clicks, codes, and analytics paths. Treat the answers as directional evidence, not perfect attribution.
The report should answer four commercial questions:
- Revenue: What tracked revenue remained after refunds and applicable costs?
- Acquisition cost: What did each customer or qualified action cost?
- Incrementality: What demand was additional rather than already likely?
- Payback quality: Did customers return, or did discounting create one-time orders?
That ordering shifts the meeting from “which post earned the most likes?” to “which creator produced efficient, incremental demand, and what should we change next?”
Defining the KPIs That Actually Matter
A reliable influencer marketing report begins before the first creator publishes. Write a measurement contract that names the campaign objective, primary KPI, supporting metrics, cost definition, attribution window, and source of truth. Without those decisions, each reporting cycle turns into an argument over which spreadsheet is correct.
Survey benchmarks need the same discipline. A percentage may describe only respondents who answered one question, while a multi-select response measures how often an option was selected, not its share of spend or exclusive use. Document those denominator rules in the internal methodology notes, following the guidance in the Influencer Marketing Benchmark Report.
Choose one number first
Choose the metric that matches the campaign's commercial job. A conversion campaign may prioritize CPA, code redemptions, qualified signups, or revenue. An awareness campaign can use total reach, provided the report also defines the downstream signal that will show whether that reach contributed to demand. Where testing is available, incremental conversions or revenue provide a stronger primary outcome than reported engagement.
Use this sequence:
- Write the objective in operational language. “Support product discovery” is too broad. Specify whether the campaign should acquire customers, generate qualified traffic, create reusable assets, or increase demand within a defined audience.
- Select one primary KPI. Set a single One Big Number, such as CPA, code redemptions, incremental revenue, or total reach. The report then answers, “Did it work?” without letting a collection of secondary metrics obscure the result.
- Add a small supporting set. Include metrics that explain the primary result, including spend, tracked revenue, clicks, conversion rate, reach, watch-through, survey-assisted discovery, or test-versus-control lift.
- Define every denominator. Record whether engagement rate uses reach, impressions, or followers. State whether CPA includes creator fees, products, shipping, production, paid amplification, and platform costs.
- Freeze the logic. Keep definitions consistent across campaigns while the objective remains the same. If the methodology changes, mark the break clearly instead of presenting the new result as a continuation of the old series.
A KPI hierarchy keeps the dashboard from becoming a catalogue of platform exports. The executive view should show the objective, primary KPI, spend, result against target, and decision required. The operator view can hold creator-level diagnostics, post-level performance, audience quality, content rights, and the evidence supporting incremental or survey-informed conclusions.
Teams building a broader measurement system can use this guide to profit-driving KPIs by Arlo Inc. for context on connecting marketing metrics to commercial performance. Use it as a reference, not a reason to add every available metric.
Recent benchmark reporting cites an average of $5.78 earned for every $1 spent, 74% of marketers planning to increase influencer budgets in 2026, and 59% already using AI in influencer operations. It also reports that 26.2% of practitioners cite ROI measurement as a persistent obstacle. These figures appear in recent influencer marketing benchmark reporting, but they do not replace campaign-level evidence or clearly defined denominators.
Building a Bulletproof Attribution Model
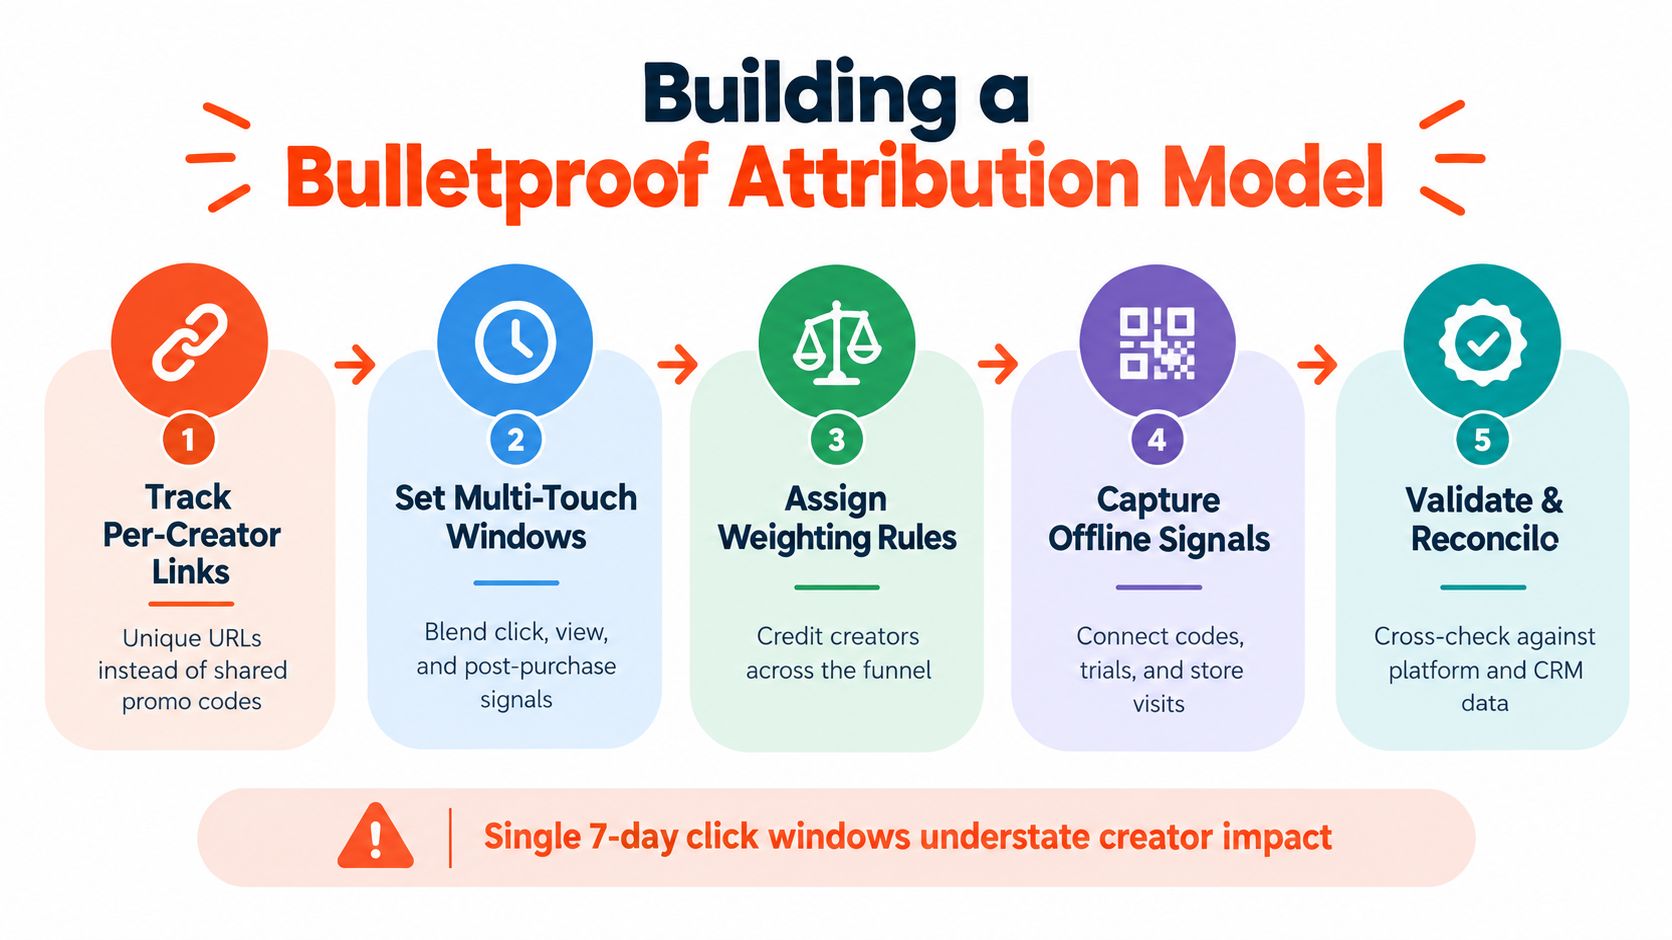
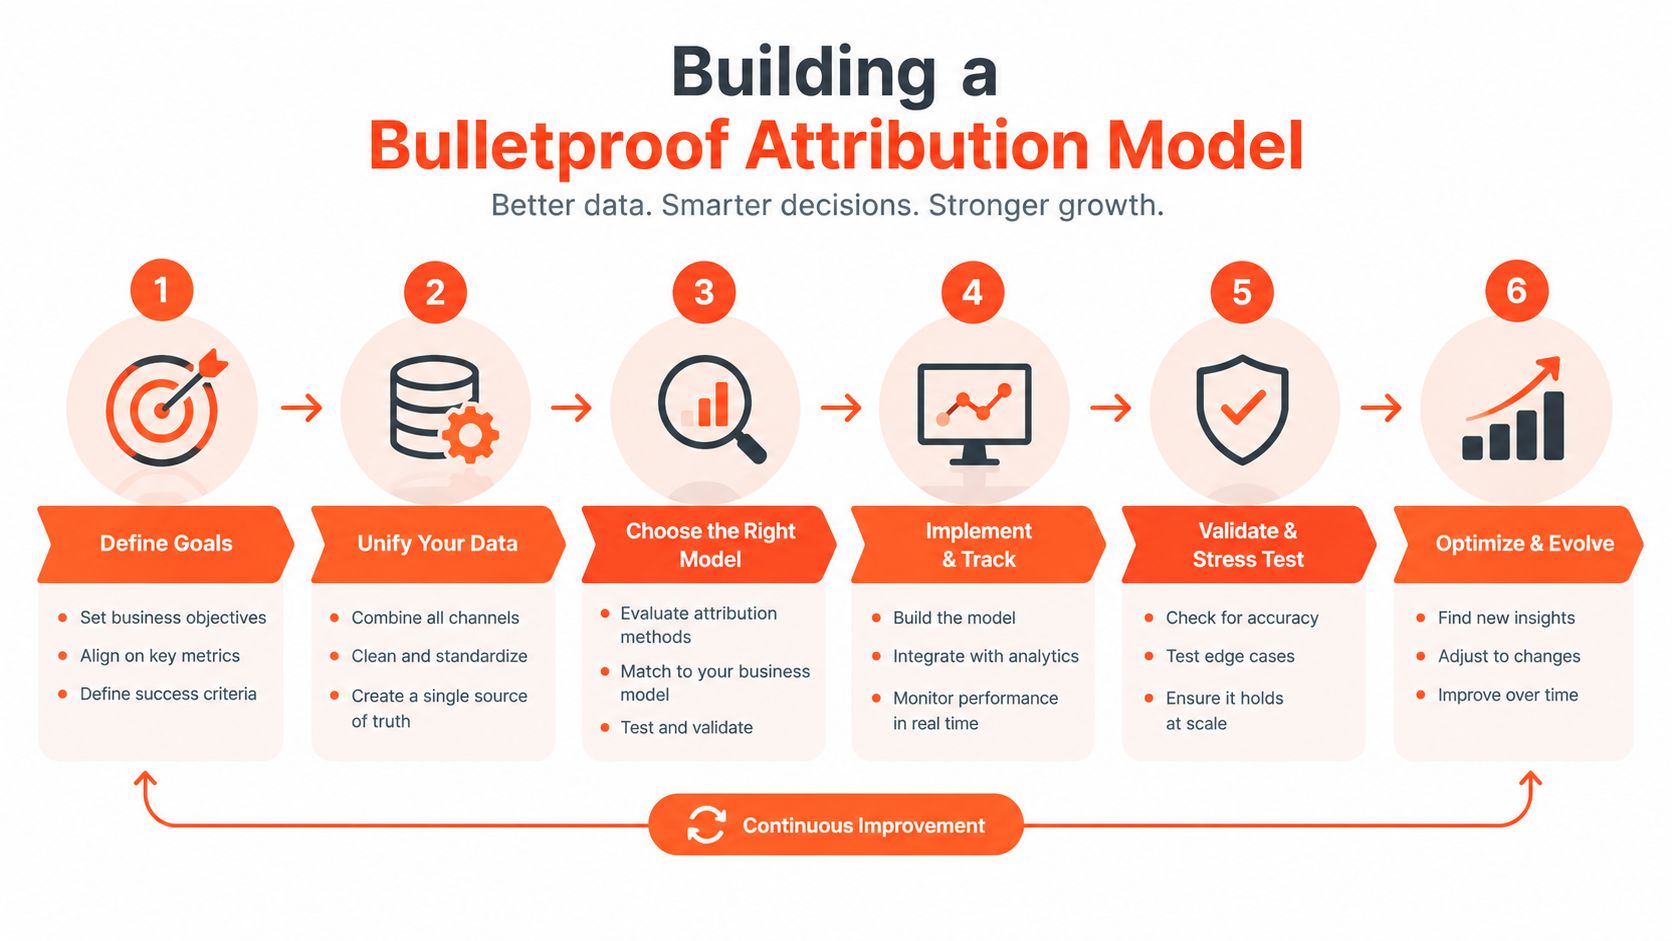
A creator link rarely captures the full buying journey. Someone can watch a creator's video, visit the site, leave without purchasing, discuss the product with a friend, return through branded search, and convert after an email. A last-click report assigns that sale to email and hides the creator's role. Treating platform attribution as revenue truth creates confident reporting with weak commercial evidence.
A 7-day attribution window may miss purchases that occur weeks after exposure. A shared promo code creates a different blind spot. It can confirm campaign redemptions, but it cannot show which creator, post, or platform created the demand. Before setting the window or defining costs, use this guide on how to measure influencer marketing ROI to connect tracking choices with commercial outcomes.
Build the tracking layer per creator
Assign every activation the same tracking package before content goes live:
- Unique tracking link: Include creator and content identifiers in the URL so traffic can be separated by person, platform, campaign, and asset.
- Creator-specific code: Give each creator a distinct checkout code. Keep it available for retail conversations and customers who remember the code but do not use the link.
- Pixel and analytics events: Record landing-page visits, product views, signups, checkout starts, purchases, and other actions tied to the campaign objective.
- CRM persistence: Save campaign and creator parameters on the lead or customer record. Later conversions should not overwrite the original source.
- Post-purchase survey: Ask customers how they discovered the brand and what influenced the purchase. Separate creator content from paid retargeting, search, recommendations, and other plausible influences.
No single tracking method captures every buyer. Links measure identifiable traffic, codes reveal some dark-social and offline behavior, pixels connect sessions with later actions, and surveys expose influence that analytics tools cannot observe directly. The reporting job is to reconcile these signals rather than force every conversion into one channel.
Separate attributed sales from incremental sales
A tracked conversion is not automatically incremental. A customer may click a creator link after deciding to buy, or another channel may have influenced the same purchase. An influencer marketing report therefore needs two distinct views: observed attribution and incrementality evidence.
A practical incrementality study follows the four stages in Aspire's guide to influencer marketing sales ROI, which also notes that only 29% of marketers use marketing mix modelling:
- Identify the audience exposed to creator content.
- Build a comparable non-exposed control group.
- Match both groups to actual purchase data.
- Compare spend, purchase frequency, and new-customer acquisition across the campaign window.
Design the control group before launch and protect it from accidental exposure where possible. Geo-based tests, audience holdouts, and matched customer groups can help separate creator lift from seasonality and concurrent paid-media activity. The control group does not need to be perfect to produce useful evidence, but the comparison must be credible enough to support a budget decision.
Marketing mix modelling offers a broader channel-level view. It is underused, so teams should establish disciplined per-creator tracking and post-purchase surveys first, then add controlled tests as volume and data quality improve. Reporting should show where evidence is strong and where it remains directional.
Label every result clearly:
- Directly tracked: Connected to a creator link or code.
- Assisted: Influenced by creator exposure but converted through another recorded touchpoint.
- Survey-reported: The customer named creator content as a discovery or purchase influence.
- Incremental: Supported by a control or lift test.
- Unresolved: A plausible signal that the available evidence cannot yet validate.
This vocabulary gives leadership a more accurate view of creator contribution than a single inflated ROAS figure. It also makes the next budget decision easier: scale proven lift, investigate conflicting signals, and avoid paying twice for demand another channel would have captured.
Designing Dashboards for Weekly Optimization
A weekly dashboard should help a manager make decisions before the next batch of content goes live. It shouldn't be a beautifully formatted archive of platform screenshots. The first screen should show spend, primary KPI, tracked revenue, CPA or ROAS where relevant, and the change required from the team.
The next layer should answer three operational questions: which creators deserve more budget, which content deserves reuse, and where is the measurement incomplete?
Use a layered dashboard
The top row can contain the campaign rollup. Keep it compact:
- Primary outcome: CPA, revenue, redemptions, qualified actions, or reach, depending on the campaign objective.
- Efficiency: Spend against the chosen outcome, with costs defined consistently.
- Trend: Current performance compared with the campaign baseline or previous reporting period.
- Attribution quality: The share of conversions supported by links, codes, surveys, or testing.
- Decision flag: Scale, hold, revise, investigate, or stop.
Below that, use a creator scorecard. It should let the team sort by tier, platform, content format, direct CPA, paid amplification performance, and incrementality status. Keep direct attribution and validated lift in separate fields. Combining them into one blended score makes it impossible to tell whether a creator is driving sales directly or contributing valuable upper-funnel demand.
| Creator Tier | Direct CPA | Code Redemptions | Paid Spark ROAS | Incrementality Lift |
|---|---|---|---|---|
| Micro | Track by creator | Track by creator | Track when amplified | Validate with testing |
| Mid-tier | Track by creator | Track by creator | Track when amplified | Validate with testing |
| Macro | Track by creator | Track by creator | Track when amplified | Validate with testing |
The table is a reporting structure, not a benchmark. Populate it with your own verified data, and don't compare tiers without accounting for audience, format, fee model, and conversion lag.
Connect organic content to paid media
Creator content often continues working after the original post. Industry reporting says 100% of surveyed marketers repurpose creator content beyond the creator's own feed, and 77% of brands reuse creator content in paid ads, according to Linqia's report on the next era of influencer marketing. That makes rights, asset IDs, paid spend, and downstream conversions part of the same reporting record.
Add an asset table with the creator, platform, post ID, format, usage-rights expiry, organic results, paid campaign ID, paid spend, paid conversions, and current status. A high-performing organic post isn't automatically a strong ad. Paid amplification changes the audience, delivery system, and creative context, so report the two environments separately before comparing them.
If you're evaluating platforms for this workflow, a practical resource to compare creator software tools can help you assess discovery, content management, analytics, and asset workflows. The dashboard still needs a clear data owner, because no software fixes inconsistent naming or missing creator identifiers.
A weekly meeting should end with documented actions. Increase the next test allocation, request a new hook, extend a usage right, investigate a tracking gap, or remove a creator from the next wave. If nobody changes a decision after reading the dashboard, the report is still too decorative.
Adapting Reports for Platform and Format Nuances
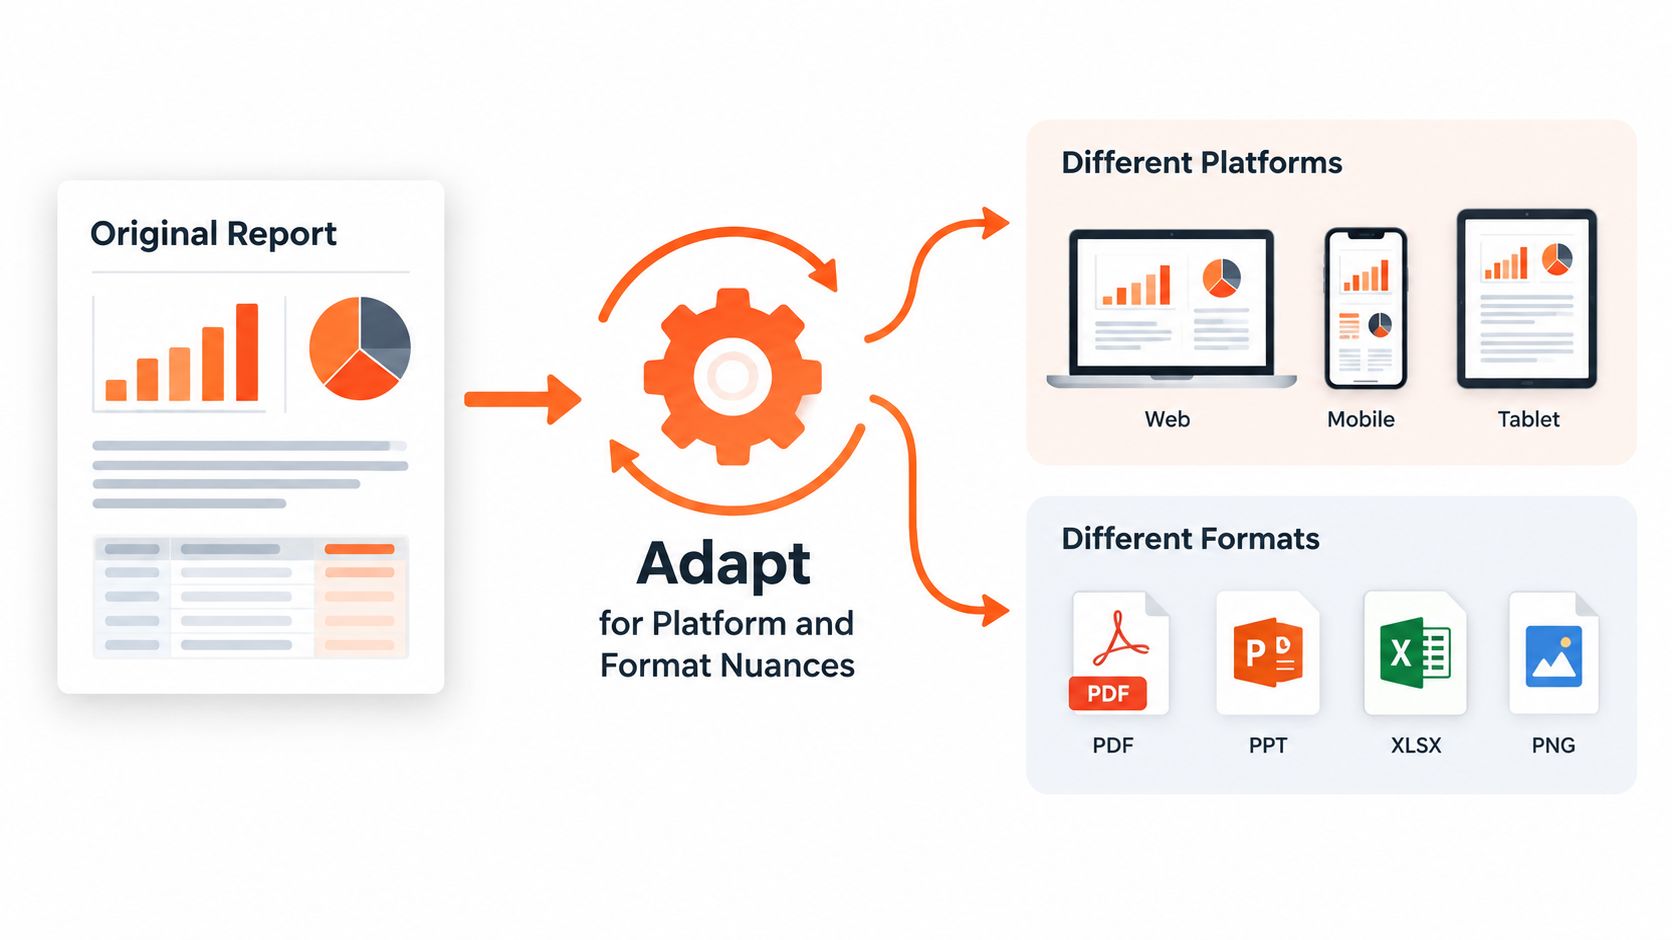
A single benchmark cannot describe every creator placement. A YouTube integration, TikTok Shop video, Instagram Reel, paid UGC asset, and Twitch live segment create different paths to action. An outcome-based influencer marketing report keeps those paths visible instead of compressing every placement into one engagement-rate column.
Follower count is a weak screening shortcut. Sprout Social reports that only 17% of consumers check follower count before engaging, while 44% feel uncomfortable with brands using AI influencers. Its report also says 32% of brands already sell on TikTok Shop and another 25% plan to do so, according to the 2026 influencer marketing report. Use those findings as market context. In the campaign dashboard, report audience relevance, trust signals, creative fit, product consideration, and commercial outcomes alongside reach.
Measure the format, not just the platform
For short-form video, track opening-hook retention, watch-through, shares, saves, profile actions, clicks, and assisted conversions. Separate the creative variables where the data allows. A product demonstration may outperform a testimonial because it answers a buyer question, not because the creator has a larger audience.
Commerce-linked placements require additional fields: product views, add-to-cart actions, code use, checkout completion, commission cost, and shop activity after exposure. Connect those events to creator IDs and campaign dates, then compare them with baseline store activity. Platform adoption does not prove incremental revenue. Hold out comparable audiences or periods where possible, and use post-purchase surveys to ask how customers discovered the product. Survey responses will not replace attribution, but they can reveal creator influence that links and codes miss.
UGC needs an asset-based view. The creator may be paid to produce content that the brand later distributes through paid social, product pages, email, or app-store placements. Attribute production cost to the asset, then report results by distribution channel, audience, paid spend, and conversion quality. A report should show whether the asset generated efficient demand in several environments, rather than assigning every paid-media result to the original creator.
Match the conversion window to the format
YouTube long-form integrations often need a longer evaluation horizon than short commerce videos. Viewers may save a recommendation, research later, and return through another device. Live formats can produce concentrated bursts of chat, clicks, and code use, yet their audience and timing may not compare cleanly with a standard feed placement. For a practical TikTok versus YouTube format comparison, align the reporting window with each platform's path to action.
Instagram and TikTok also need different creative diagnostics. Retain the original denominator for every rate, and compare like with like. A view-through rate, click-through rate, or conversion rate is useful only when the exposure definition, attribution window, and audience base remain clear.
The most useful segmentation usually includes:
- Platform: Where distribution happened.
- Format: Reel, short video, integration, live segment, UGC, or commerce placement.
- Audience fit: Whether the creator reaches the intended buyer.
- Commercial path: Link, code, shop, app store, lead form, or assisted journey.
- Reuse status: Whether the content was amplified and under what rights.
- Measurement confidence: Whether results come from platform reporting, CRM records, surveys, or incrementality testing.
That structure shifts budget decisions away from follower totals and surface engagement. Performance teams can see which creator assets produce qualified demand, which formats assist later conversions, and which placements deserve another controlled test.
Turning Data Into Actionable Iteration
A report becomes valuable when it changes the next decision. The weekly review should be short and operational, while the monthly review should assess whether the program is on track. Longer-window analysis should determine whether early winners remain efficient after delayed conversions and incrementality checks.
Run three review rhythms
Weekly, review the machine. Confirm which content went live, whether every link and code works, which creators are delivering the intended format, and where early signals justify a creative or budget adjustment. Don't make permanent creator decisions from a single volatile snapshot.
Monthly, review allocation. Compare creators, formats, platforms, paid amplification, and customer quality against the primary KPI. Identify the experiments to repeat, the assumptions to retire, and the tracking gaps that prevent a confident conclusion.
At the longer program review, review the economics. Reconcile direct conversions with survey responses and incrementality evidence. Evaluate renewal decisions, pricing structure, rights value, and whether the program is creating reusable media assets as well as immediate demand.
Outcome-based commercial models work only when the outcome is defined before launch. Agree on whether the performance component is tied to installs, conversions, qualified actions, or ROAS, then document which data source wins when platform and CRM totals disagree.
Turn findings into specific briefs
A weak learning says, “Short-form content performed better.” A useful learning says, “The content with a clear demonstration generated stronger click and conversion signals, so the next brief should open with the product use case and keep the offer visible.” The second version gives the creator and paid team something they can execute.
Use the report to make decisions at three levels:
- Creator: Renew, test a different brief, change the offer, or pause pending audience-quality review.
- Content: Recut the opening, test a new proof point, alter the call to action, or grant paid usage rights to a promising asset.
- Budget: Shift the next allocation toward the combination of creator, format, and platform that has evidence behind it, while reserving budget for controlled tests.
AI can help with production planning and variation, but it doesn't remove the need for trust and disclosure. For teams experimenting with synthetic or assisted creator concepts, resources such as AI influencer templates can support workflow development. The report should still separate AI-generated assets from human creator partnerships and monitor audience response, disclosure quality, and commercial outcomes.
The mature approach is not to pretend attribution is perfect. It is to make uncertainty visible, improve the measurement design each cycle, and avoid scaling a result that exists only because the reporting model gave it credit.
Social Cloud plans, runs, and measures creator campaigns across YouTube, Instagram, TikTok, and Twitch, with per-creator tracking links, promo codes, post-purchase surveys, and weekly reporting for views, CTR, conversions, and ROAS. If your team needs an outcome-linked influencer program rather than another vanity-metric recap, visit Social Cloud to discuss a measurement framework built around your actual purchase cycle.